


Table Of Contents
Apparently, performance on a website is essential. Slow sites are a pain for all visitors, and often slow sites put excessive load on the servers as well. To improve the performance of a website, a few tools will help us to pinpoint areas to enhance. It is a combination of settings in Nginx and Wordpress. It builds on the setup described in this article but you can use the advice standalone. Most of the optimizations are useful on any web platform, not just Wordpress, and Nginx.
The key to improving performance is to measure. So first we establish a baseline for the performance, this will allow us to evaluate each change in the settings to see if it change the performance profile.
There are many different ways to measure performance which is a discussion all on its own. I use the time it takes to load the full site in a browser. Which means all images, scripts and of course the HTML of the page.
The easiest way to do this is to use a tool like gtmetrix.com it shows load time, total download size and advice on what to change to improve speed. It is built on Google Page Speed and Yslow.
Baseline performance
To get a performance baseline, five tests on gtmetrix was used to compile an average load time.
The average load time was: 5.1 sec, with minimum 5.0 sec and maximum 5.2 sec.

Which load speed should we aim for? As Maile Ohye puts it:
QUOTE: “2 seconds is the threshold for ecommerce website acceptability. At Google, we aim for under a half second.” Maile Ohye, from Google
The load time is quite far from this goal - but lots of improvements are possible.
What to optimize?
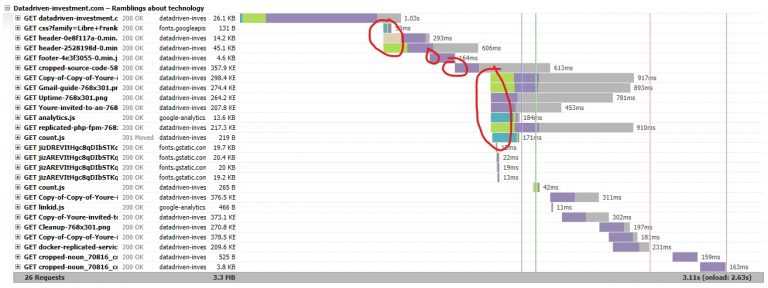
A page load consist of multiple downloads/requests, in the baseline above, it shows 28 requests. They can be broken into parts using a waterfall diagram as shown here:
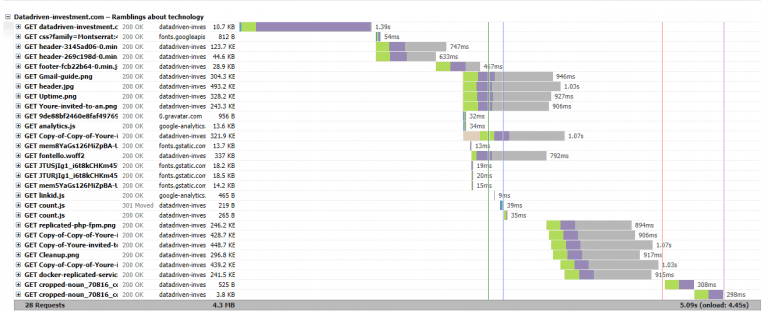
The first request is the key to the following requests; it contains the HTML that directs all the subsequent requests. So we will never be able to have a total load time that is faster than this because all the remain requests cannot start before the first request is finished. The bars are color-coded, the purple color is “waiting”, where the server is processing the request, and the browser waits for a reply. In the first request, it is where most of the time is spent. It is where to improve first.
Performance of Wordpress templates
Not all templates are created with performance in mind. Since most of the time is spend in the first request, I tried to switch to the default Wordpress template to see the difference.
A significant speedup! Just by changing from the template Cronus to the default Twenty Seventeen. The templates are very similar in look and feel. I will keep the best performing template.
Five new measurements, gives an average load time of 3.82 sec, with minimum 3.7 sec and maximum 4.0 sec. A performance improvement of 25% not bad for a single change.

Improving Nginx settings
Gtmetrix also suggests improvements in the settings on the web server. On this setup, they suggested the following:
- Keepalive should be enabled
- Set Browser caching headers
- Gzip content
Keepalive
Allowing the browser to skip the initializing step for each request saves a lot of time. When looking at the first waterfall chart, above, the green part of each bar is the connection time. It is mostly removed when keepalive is enabled.
In Nginx keepalive is default enabled so due to a configuration error earlier I had it disabled, so I just removed the setting, and it worked.
Gzip
Transfering less data is also crucial from a speed perspective, it takes less time to transfer fewer data. Nginx can gzip the content on-the-fly. It takes a small amount of CPU to do it, but it depends on the compression level selected.
A small benchmark of the compression level, from 1-9 shows that it should be set to around 6 to get the best tradeoff between CPU usage and compression.
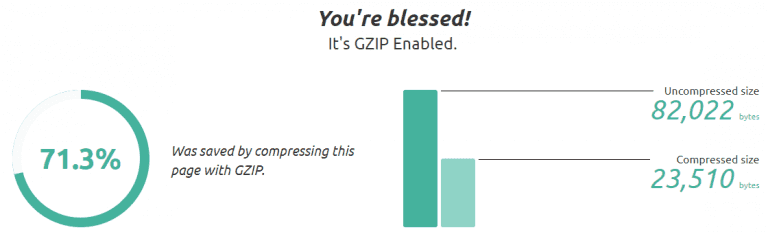
To see the compression rate the website, www.websiteplanet.com/webtools/gzip-compression/ is helpful, for the frontpage URL:
The default setting in Nginx is, only gzip the mime type text/html. But we also want to compress, javascript and CSS. It is done using the setting, gzip_types; I use this setting:
gzip_types text/plain application/javascript application/x-javascript text/javascript text/xml text/css;
Be aware that Nginx does not send gzip content through a load balancer as default, so you need the configurations described here.
With those optimizations, the load time drops even more. Average 2.98 sec, minimum 2.7 sec maximum 3.1 sec. An improvement of 19%

Browser Caching Headers
When you browse a site, many of the static files will be the same across page requests. There is no need to reload them on every page. To inform the browser that it can cache them across requests, caching headers are used.
This change will not improve the benchmark, because it times the first-page load. But it will still notify if any requests are not cached as a suggestion. And it enhances the browsing experience a lot. In my browser, a full page load takes around 4.5 sec, and subsequent loads take approximately 1.5 sec.
I pulled the caching rules from this guide.
- Cache image file for one month, and disable logging requests for them
- Cache javascript and CSS for one year, and disable logging requests for them
The add_header Cache-Control “public”; allows all systems, like proxies to cache the content, since there are nothing secret about the data this is fine. If it were set to private, only the users’ browser would be able to cache it. The cache headers prepare for a CDN as described below.
Using a CDN
Next optimization is to use a Content Delivery Network(CDN) to improve the performance further.
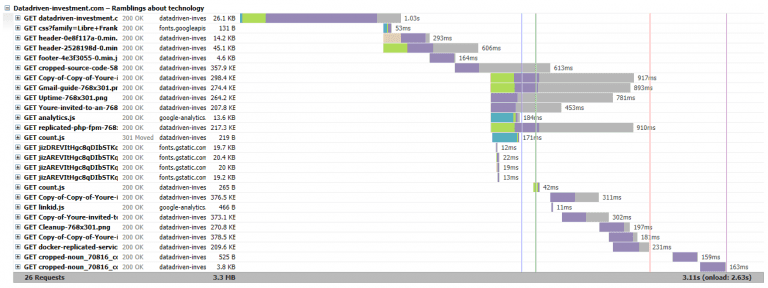
The waterfall diagram from before shows us that the static content is loaded in a cascading manner. All browsers limit how many concurrent connections they make to the same domain, so even if all HTML is loaded and the browser know which requests to make it will queue them and only have 2-8 concurrent connections per domain.
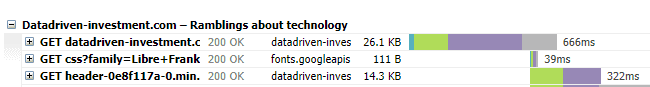
A CDN can improve it because it offloads the requests to a different domain. The waterfall changes as shown below:
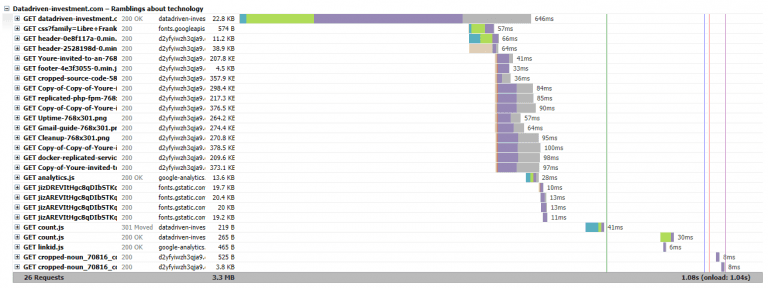
Two things to notice, the static requests are loaded in parallel, and the download time is much lower. The gtmetric system uses a server in Canada, and the web server is located in Ireland, so the load time across the Atlantic is not that great. But the CDN system has edge location all over the world so it will improve the load time for the Canadian server, which is a nice added benefit on top of the parallel loading. To add the CDN to Wordpress I installed the plugin CDN Enabler. It allows us to enter any domain, it then prefixes it in front of any path that points to files in the wp-include and wp-content folder.
So the URLs are rewritten from:
/wp-content/uploads/fvm/out/header-cb050ccd-0.min.js
_to:
https://d2yfyiwzh3qja9.cloudfront.net/wp-content/uploads/fvm/out/header-cb050ccd-0.min.js_
Many different CDN providers exist
Setting up Amazon CloudFront
Since the setup runs on AWS, the natural choice for me is to use Amazon CloudFront. It can run almost with default settings.
First, create a new distribution:
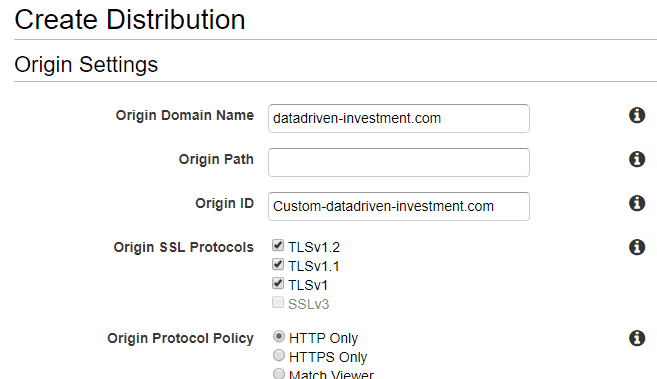
Add the domain to the “Origin Domain Name”. The only other settings I changed is
- “Compress Objects Automatically”: Yes
- “Query String Forwarding and Caching”: “Forward all, cache based on all”
When the distribution is created, it takes a while to get deployed. But it shows up immediately in the interface where it gives a domain name ready to copypaste to Wordpress.

The performance with the CDN is again measured using five tests on gtmetric.
Average 1.66 sec with maximum 2.6 sec and minimum 1.1 sec. A performance improvement of 44%

Remaining optimizations
In the final step, you can see that the score is A(93%) and A(92%). The remaining recommendations are grouped into two types. External dependencies and on-page, optimizations.
External dependencies
Many of the recommendations that are left point to external resources that is loaded on the page. Google Analytics, Disqus, and so on.
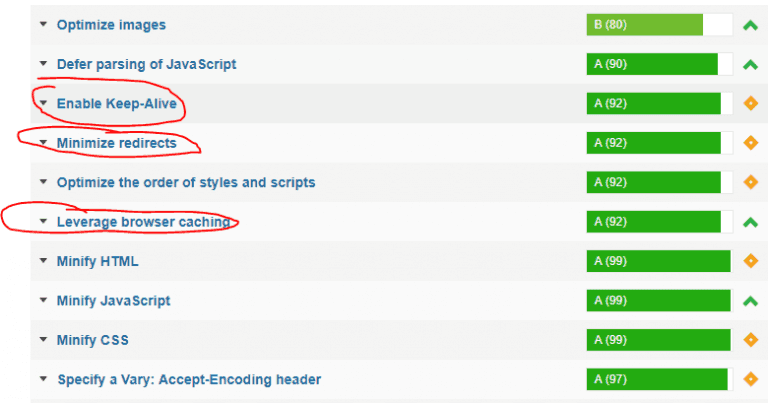
For example - cache headers for the analytics.js script needed to support Google Analytics are only two hours. This gets the recommendation to get triggered. Disqus javascript is not loaded using HTTP but does a redirect to the HTTPS version, causing the “Minimize redirects” rule to be triggered.
All of those are not anything we can change, so we have two options, either accept the “errors” or do workarounds. I prefer just to accept it since it does not have any meaning full impact on performance.
On-page optimizations
The rest of the optimizations are for on-page things, like compressing images more, minifying HTML, making javascript load after the rest of the page is loaded. But it requires some infrastructure to handle the cases for minimal gain. So I will leave it as it is.
Conclusion
The loading time was improved from 5.5 sec to 1.1 sec or 78% - I am happy with this improvement, there are still ways to improve further, but that requires more integration into Wordpress which is out of the scope for this article.
Share

Related Posts
Legal Stuff