Table Of Contents
I just viewed a webinar from Nasdaq which talks about using sentiment analysis to predict price movements in stocks. You can find the webinar here, very interesting subject. The presenter shows that the sentiment in many cases are an early predictor of the price movement. Of course the webinar is also a sales pitch for the new analytics hub that Nasdaq has build which currently consist of nine datasets, one of them are the sentiment data. All the nine datasets are in the group of “alternative data” which is all the new rage in the financial sector.
Read more to get an overview of the key points from the webinar and a few my takes on pitfalls in this area and how to do similar sentiment analysis on you own.
First an overview of the key points from the webinar
Data generated worldwide roughly consist of two types:
- Structured
- Unstructured
The structured data are the data that is generated by the exchanges like prices, dividends and so on.
All the remaining data are unstructured data, it consist of twitter posts, satellite images, Facebook posts, chat messages, counting cars in Walmart parking lots and everything else. So it is a very broad area. The thought is that this data can be used to provide extra alpha to a trading strategy, but it is more difficult to analyse than the structured data. But it is catching on because of machine learning.
The amount of unstructured data generated each second is the same as New York Stock Exchange generates in a whole day.
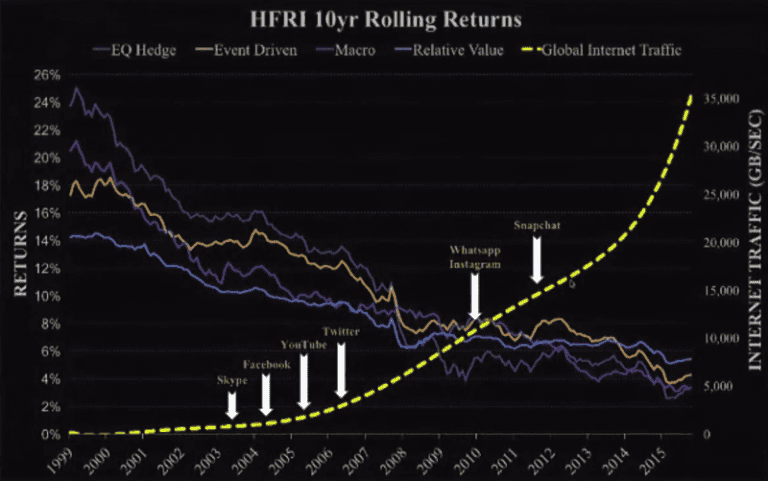
The presenter argues that as the growth of the Internet increases, the return from hedge funds go down. This might be due to the possibility that any person with an Internet connection are able to find there own alpha, if they are able to ask the right questions. Information are no longer just reserved for Wall Street. This trend is shown in the image below.
I apologize for the fuzzy image quality, they are screenshots from the webinar which was not the best in resolution.

Their dataset tracks the sentiment on twitter data. They process around 2500 tweets a second. Each tweet are analysed by an algorithm for sentiment, that is, is the tweet positive or negative and which instrument is it about. This data are then used to plot a graph of how sentiment change over time. The argument to why this works is the “wisdom of the crowd”. For example many netflix users are on twitter and if netflix starts to get in trouble it should show up in negative tweets. Similar for positive sentiment.
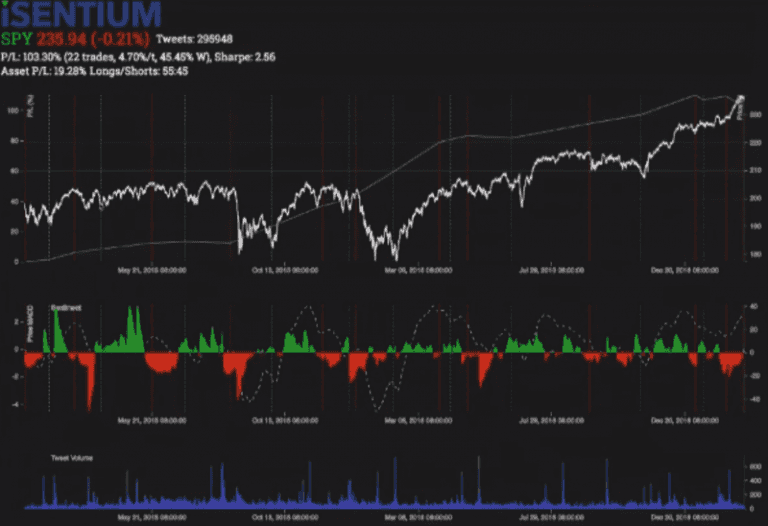
This is shown in the graph for S&P 500 with sentiment below.

On top there is the price movement for S&P 500, in white/grey. The red/green part is the sentiment, and the dashed line is the average of the price above. It is easy to see that there are overlaps between green sentiment and price going up and red sentiment price going down. So in this case the hypothesis holds.
The presenter showed many charts where the same pattern was repeated. Only place where he thinks this pattern breaks down are if there are low amounts of data. Like a very boring company or sector. I would expect that utilities would be difficult to predict with this data because nobody tweets about them. But companies like Apple, Netflix, GoPro and similar are probably going to give good correlation because there are actually people tweeting about them all the time.
They have history going back to 2007. When asked about how to apply this data to stock picking he talked about looking at the sentiment for three different levels.
- The broad market
- The sector
- The specific stock
But that is no different from most other stock picking methods I think. The presenter did not go into any details about how to apply this anyway.
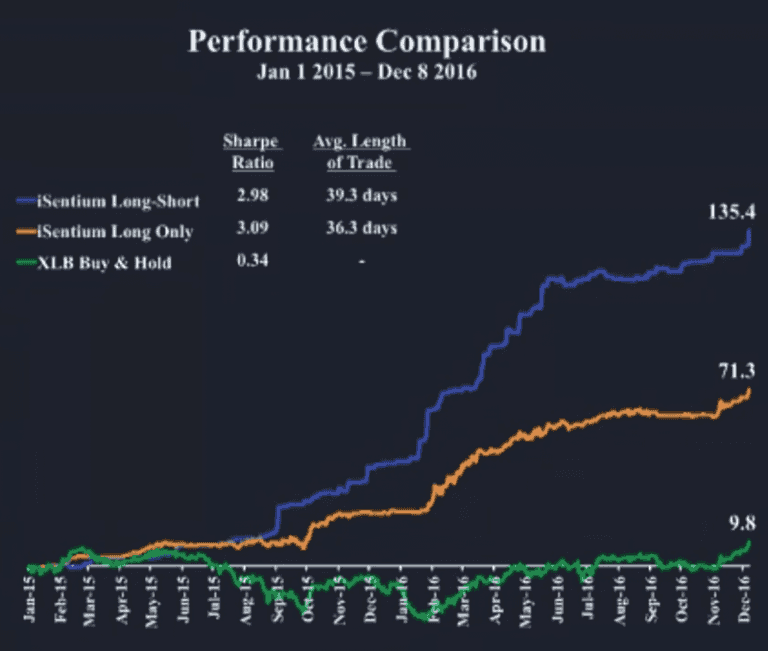
Finally they showed a performance graph for a simple trading strategy that applies the sentiment data.

The strategy is a very simple momentum strategy, if the sentiment is positive for the last 5 days, expect momentum up and buy. And reverse for sell. If the performance is true I think this data is very promising to have part of a trading strategy.
Can I use this type of data in my own strategy?
I would say, it depends, as with every other choice in a strategy. That sentiment adds values to the decision process makes logic sense to me. But as iSentium describes, it is highly dependent on data volume. So if you trade the US large cap market I think twitter data are great. But if you trade German small cap, I think it will be difficult to get enough data to make any reasonable sentiment analysis.
But if your trading universe correlates with high volume of chatter on social media and in newspapers it seems to be worth while to try it out. There exist different datasets, not just iSentium but quandl also has datasets that are possible to use. I don’t have any experience about any of them but I might compare them to my own sentiment analysis system at a later time.
Roll you own sentiment analysis system
It sounds harder than it is. To be useful we need three parts
- A way to retrieve texts that is up to date and about our instruments
- A way to classify which instrument the text is about
- A way to evaluate sentiment of the text, is it positive or negative
Share
Related Posts
Legal Stuff


